
RANJITH MAHESH
AI Software Engineer | Data Scientist | R&D @ NgC | GenAI • MLOps | M.Sc. Digital Engineering
👋 About Me
I build end-to-end AI applications and enterprise software, taking complex data from concept to production. With over 4.5 years of experience across Accenture and NgC, I specialize in bridging data science and advanced AI with robust, full-stack software architecture.My technical focus includes:▪ GENERATIVE AI & LLMs: Designing and deploying Agentic AI applications, orchestration (LangChain), and output observability (LangSmith).▪ FULL-STACK ENGINEERING: Developing production-ready web applications and backend APIs (Python, Flask, FastAPI, JavaScript, HTML/CSS).▪ DATA ENGINEERING & MLOps: Architecting relational and vector database schemas, building data pipelines including web scraping, and managing agile dev-to-prod lifecycles on cloud platforms (Azure).▪ DATA SCIENCE & ANALYTICS: Delivering predictive models and classical machine learning solutions, including time-series forecasting, XAI, and predictive maintenance.Currently finalizing my Master's at Otto-von-Guericke University Magdeburg, I am seeking full-time roles in Germany where I can leverage my hybrid software and data science expertise to build scalable AI products.
💡Skills

AI/GenAI: LLM applications, RAG, LangChain, pgvector (PostgreSQL vector search)ML/Data Science: scikit-learn, XGBoost, PyTorch, TensorFlow; time-series forecasting; explainability (LIME, Integrated Gradients, permutation importance)Backend/Web: Python, Flask, REST APIs; HTML/CSS/JavaScriptData/Databases: SQL; PostgreSQL, SQLiteCloud/MLOps: GCP, BigQuery, Kubeflow; Docker; GitBI: Looker Studio, Power BILanguages: English (C1), German (B2)
🌟 Featured Projects
A selection of Master's graduate-level projects where I applied advanced methods and tools to solve real-world problems—covering research, implementation, and evaluation from end to end.
🛠️ Bachelor's Projects
Hands-on undergraduate projects and thesis work in automobile engineering, focused on practical design and analysis, engineering fundamentals, and documented technical outcomes.
🌟 Featured Projects
FMEA KNOWLEDGE REUSE (Master's Thesis)
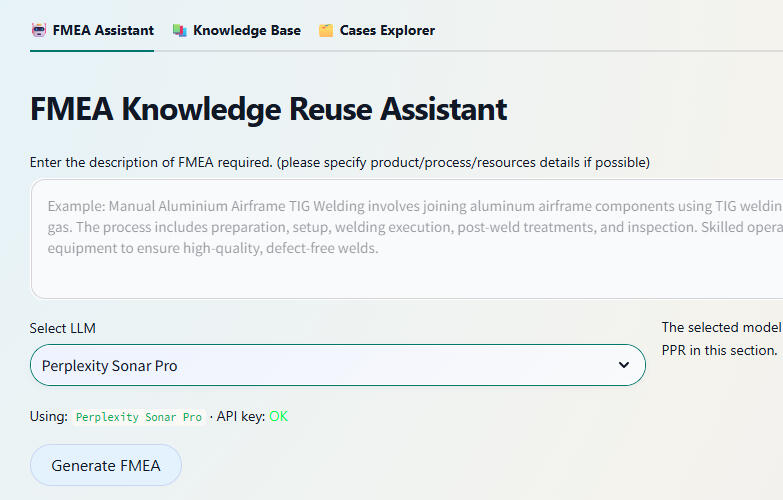
As part of my Master's thesis built a web-based AI assistant for reusing welding Failure Modes and Effects Analysis knowledge using Case-Based Reasoning. A streamlit based Retrieval‑Augmented Generation (RAG) with LLM application.
LLM-Driven MBSE Requirements Automation
Developed a web-based application for interactive Model-Based Systems Engineering (MBSE) requirements diagram design, leveraging the Perplexity AI API, Python, and Streamlit to deliver an intuitive and user-friendly interface for requirements modeling and visualization.

Feature Importance in Time Series Data
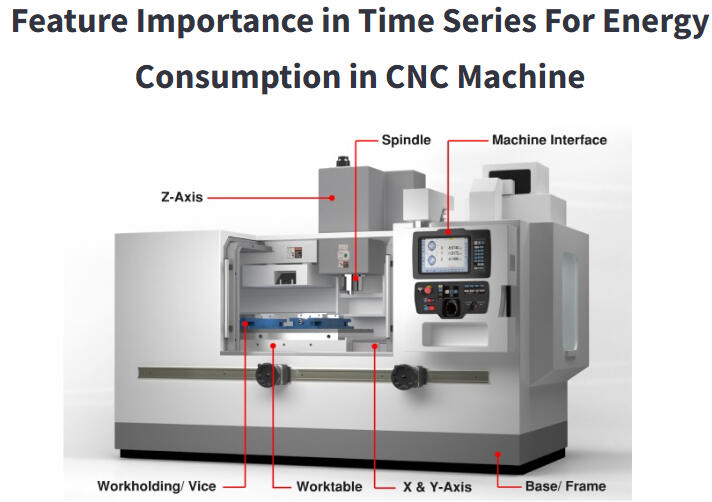
An interactive Python and Streamlit web app for analyzing and visualizing feature importance in CNC machine energy consumption time series, enabling comparison of multiple explainability techniques for key factor discovery.
Google Cloud-Enabled Analytics and Forecasting for MPD
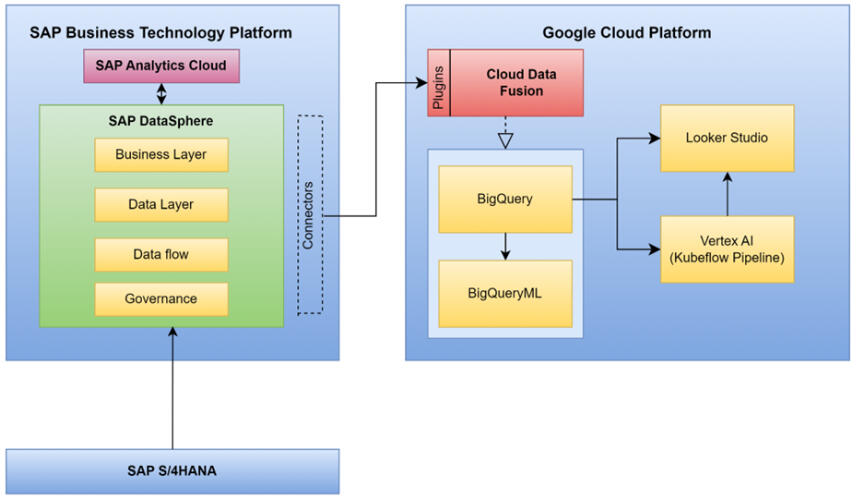
Developed an end-to-end analytics solution for forecasting sales and profits of mobility products using SAP Datasphere, Google Cloud, BigQuery ML, Vertex AI, and Looker Studio, enabling data-driven insights and strategic decision support for manufacturing and product distribution.
Visualization of Process Engineering (Calciner) using unity 3d
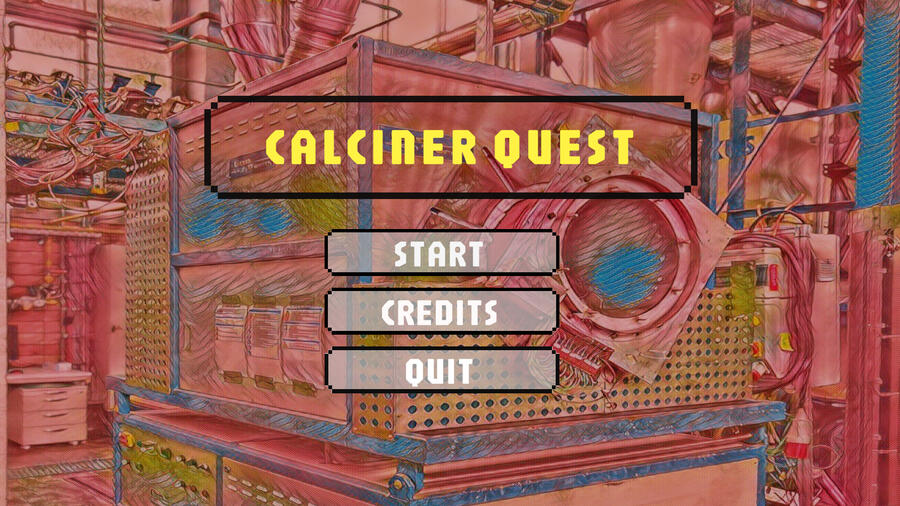
Collaborated on an interdisciplinary project with chemical engineering students to design and build a 3D calcination process simulation, utilizing SolidWorks 2023, Blender, and Unity 3D for precise modeling and interactive visualization.
Sales - Profit Visualization using power BI
Created an interactive Power BI dashboard analyzing sales and profit trends for a U.S. superstore using a multi-year Kaggle dataset, enabling dynamic exploration of regional, segment, and product category performance through various visualizations.

🛠️ Bachelor's Projects and Activities
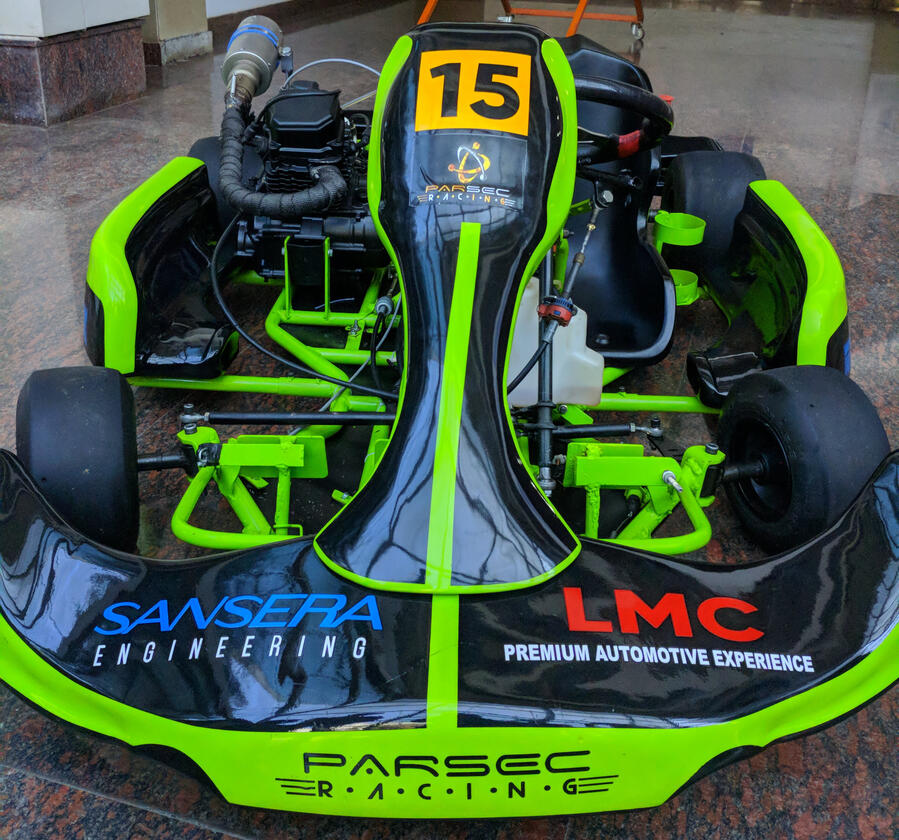
PARSEC Racing - Student Formula Kart Project (2018–2019)
Co-founded PARSEC Racing (a student motorsport team) at Dayananda Sagar College of Engineering (Bengaluru, India) and led a student team of 20 to design and build an Internal Combustion Engine powered go-kart from scratch, secure industry sponsorship, and compete in multiple Student Karting championships Nation wide.
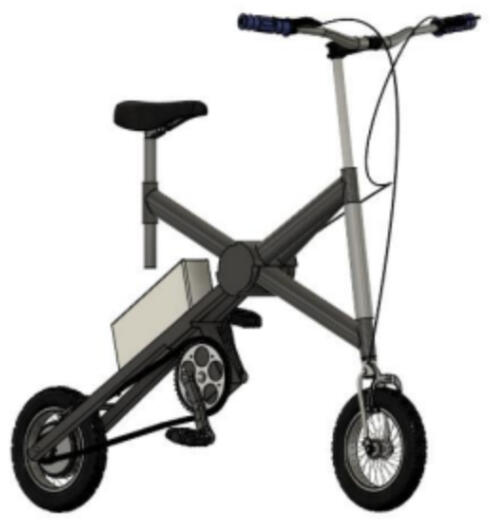
Design and Fabrication of Portable e-Cycle - Bachelor's Thesis Project (2020)
Led a 4-member team at Dayananda Sagar College of Engineering (Bengaluru, India) as Project Lead and CAD Designer to deliver a foldable, portable electric bicycle with integrated mechanical and electric powertrains, executing the complete end-to-end product development cycle—from concept visualization and requirements definition to detailed CAD design, FEA-based validation, fabrication, and build completion along with the team.
FMEA KNOWLEDGE REUSE (Master's Thesis)
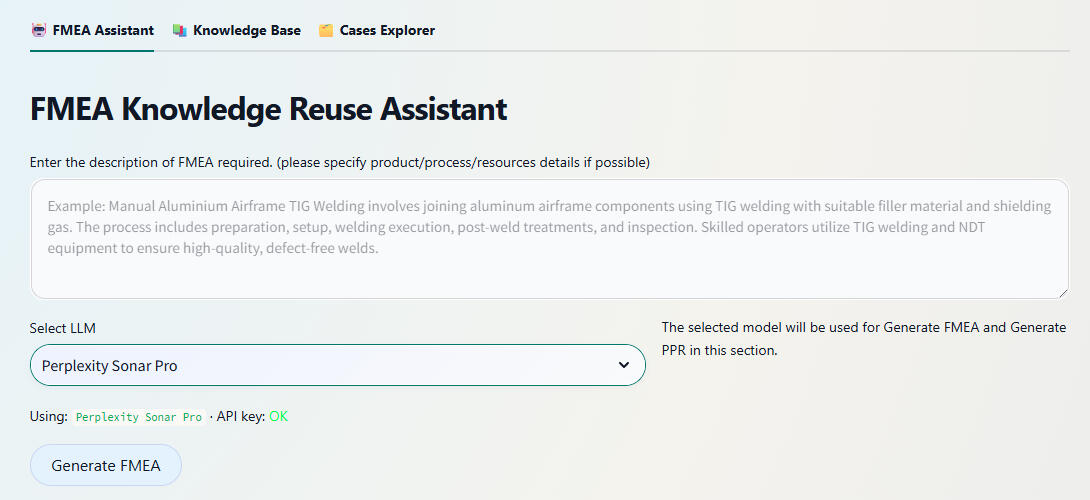
Good to read if you’re new to FMEA and Reliability EngineeringReliability Engineering is the discipline focused on predicting, analyzing, and improving the ability of systems, components, or processes to perform required functions under stated conditions for specified periods without failure. It employs probabilistic modeling, statistical analysis, accelerated life testing, and failure data analytics to quantify reliability metrics (e.g., Mean Time Between Failures (MTBF), failure rates λ), design redundancy/robustness, and establish maintenance strategies that minimize downtime and lifecycle costs while maximizing operational availability.Failure Mode and Effects Analysis (FMEA) is a systematic, structured methodology used in engineering to identify potential failure modes within a system, design, or process, assess their causes and effects, and prioritize mitigation actions based on severity, occurrence likelihood, and detectability. Through tabular analysis, FMEA documents each component's possible failure mechanisms, their impact across system levels (local, subsystem, system-wide), and preventive/detection controls, enabling design teams to proactively address high-risk failure modes before production. This risk prioritization - typically via Risk Priority Number (RPN = Severity × Occurrence × Detection) - guides resource allocation toward eliminating safety-critical issues and enhancing overall system reliability.Brief SummaryDeveloped a web-based FMEA Assistant as part of my master’s thesis at OvGU, focused on reusing existing welding Failur Modes and Effects Analysis (FMEA) knowledge instead of starting risk analyses from scratch. The application combines Case-Based Reasoning (CBR), the CRISP‑DM data‑mining process model, and Retrieval‑Augmented Generation (RAG) with LLMs to help Engineers, Domain and Non-Domain expert users to search, adapt, and extend historical FMEAs. The system is implemented with Python, Streamlit, and a Supabase backend (PostgreSQL + pgvector) for semantic search over stored FMEA cases.Problem Statement1. How can different Engineers/Users efficiently reuse existing welding FMEA data that currently lives in proprietary formats (e.g., APIS IQ exports) instead of recreating similar analyses manually for each new product or process variant?2. Can LLMs, when combined with a case base and robust retrieval, generate high‑quality FMEA rows and process element requirements (PER) without hallucinating unsafe or irrelevant failure modes?3. How can a human‑in‑the‑loop workflow be designed so that experts stay in control—editing, approving, and extending AI‑generated content—while still gaining productivity and consistency benefits?MethodologyThe app is designed around a three‑page Streamlit interface, backed by a CBR and RAG architecture:FMEA Assistant Page: Engineers/Users describe a welding step or process element in natural language.The backend retrieves semantically similar past cases from the Supabase case base using pgvector embeddings, then feeds them into an LLM.The LLM generates draft FMEA rows (failure modes, causes, effects, and actions) and optional PER entries containing input and output products, processes and resources required for the specified operation.Users review and edit all suggested rows in an interactive table before saving them as new case.Knowledge Base Page: Users upload existing APIS IQ Excel exports, which are stored as raw files in a Supabase storage bucket and automatically parsed into structured tables.Parsed data is written into the FMEA schema (cases, FMEA rows, input and output products, processes, and resources) and converted into text embeddings for semantic retrieval.From the same view, users can generate new PERs using the LLM based on the imported tables or manually type PERs and save it as a new case base.Cases Explorer Page: Provides a searchable overview of all stored cases and FMEA rows.Engineers/Users can inspect, filter, and learn about existing entries. This view supports maintenance of the case base and closes the CBR loop by capturing revised, expert‑validated knowledge.The entire workflow is guided by a Human‑in‑the‑Loop CRISP‑DM process: business understanding (welding FMEA reuse), data understanding and preparation (parsing APIS IQ, normalising FMEA rows, computing embeddings), modelling (CBR + RAG pipeline), evaluation (expert review of suggestions), and deployment (Streamlit app in daily engineering use).Key Takeaways1. The assistant turns historical FMEAs into a living case base, enabling engineers to search and adapt similar welding scenarios instead of recreating risk analyses from scratch.2. Retrieval‑Augmented Generation significantly improves LLM output quality: suggestions are grounded in real company data, while the UI ensures that humans remain the final decision‑makers.3. A lightweight tech stack (Streamlit + Supabase + pgvector + external LLM API) is sufficient to implement a research‑grade, production‑oriented CBR/RAG system for safety‑critical engineering knowledge.Steps to Use the App1. Access the Application: Visit: https://fmea-cbr.streamlit.app/2. Choose a page based on your task:FMEA Assistant:
- Enter a short description of the welding process or PER.Example prompt: Create process level FMEA rows for an Automated resistance spot welding process on automotive body parts. Focus on a maximum of 5 critical failure modes, including causes, effects, and recommended actions.- Let the app retrieve similar historical cases and generate suggested FMEA rows.
- Edit all fields as needed and save the approved rows as a new or updated case.Knowledge Base:
- Upload an APIS IQ Excel export.
- Preview the parsed FMEA table and confirm import.
- Optionally generate new PERs using the LLM or type them manually and save.Cases Explorer:
- Browse existing cases and FMEA rows with filters.
- Open any case to review and learn about its content.3. Reuse the saved cases as context for future analyses, gradually building a richer, semantically searchable welding FMEA knowledge base.
LLM-Driven MBSE Requirements Automation
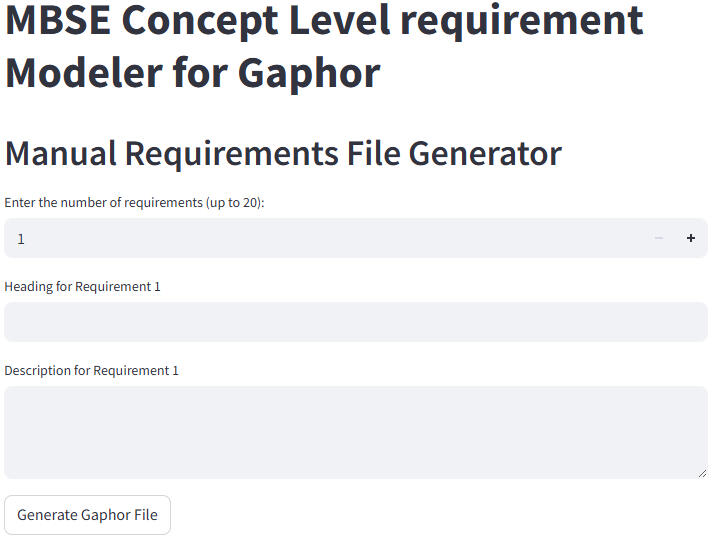
Brief SummaryDeveloped a web application in collaboration with the Systems Engineering Department, OvGU as part of my master's program, purpose-built for creating SysML-compatible MBSE requirements diagrams. The app outputs files fully compatible with Gaphor MBSE design software, using Python, Streamlit, and the Perplexity AI API.Problem Statement1. How can systems engineers or non-experts easily generate precise MBSE/SysML requirements diagrams without deep familiarity with specialized design tools?2. Can AI streamline the translation of plain English requirements into industry-standard MBSE models?3. How do we enable users to modify and maintain requirements models efficiently, supporting both manual and automated workflows?MethodologyDesigned and implemented a three-mode Streamlit web application:Manual Mode: Users input up to 20 requirements (with heading and description). The app instantly generates and lets users download a ready-to-open Gaphor SysML requirements file—ideal for those comfortable with requirements but not MBSE drawing tools.AI-Based Mode: Users enter requirements in plain English. The integrated LLM (AI) interprets and transforms these inputs into properly-structured, industry-grade SysML requirements diagrams, handling the complexity behind the scenes.Modification Mode: Users upload an existing Gaphor file and perform CRUD operations—edit, delete, or add new requirements—directly through the interface, simplifying maintenance and iteration.Ensured every file is 100% compatible with Gaphor, eliminating friction in the MBSE workflow. Implemented robust backend logic for diagram structuring, AI prompting, and file export, following SysML standards.Key Takeaways1. The tool dramatically lowers the barrier for creating high-quality MBSE diagrams, making requirements engineering accessible to all.2. AI augmentation speeds up the specification process and minimizes errors in requirements models.3. Direct Gaphor compatibility streamlines downstream system design and documentation processes.Steps to Use the App1. Access the Application: Visit: https://llmautomation.streamlit.app/2. Select your desired mode:
Manual Mode: Enter up to 20 requirements; download the Gaphor-compatible file.AI-Based Mode: Type requirements in plain English; let the app and LLM generate a rigorous SysML MBSE diagram.Modification Mode: Upload an existing requirements file; add, edit, or delete requirements as needed.3. Download your Gaphor file.4. Open the file with Gaphor MBSE design software to view and further modify your SysML requirements diagram.If you don’t already have the Gaphor tool installed, you can download the latest version for Windows or Mac from the official website:
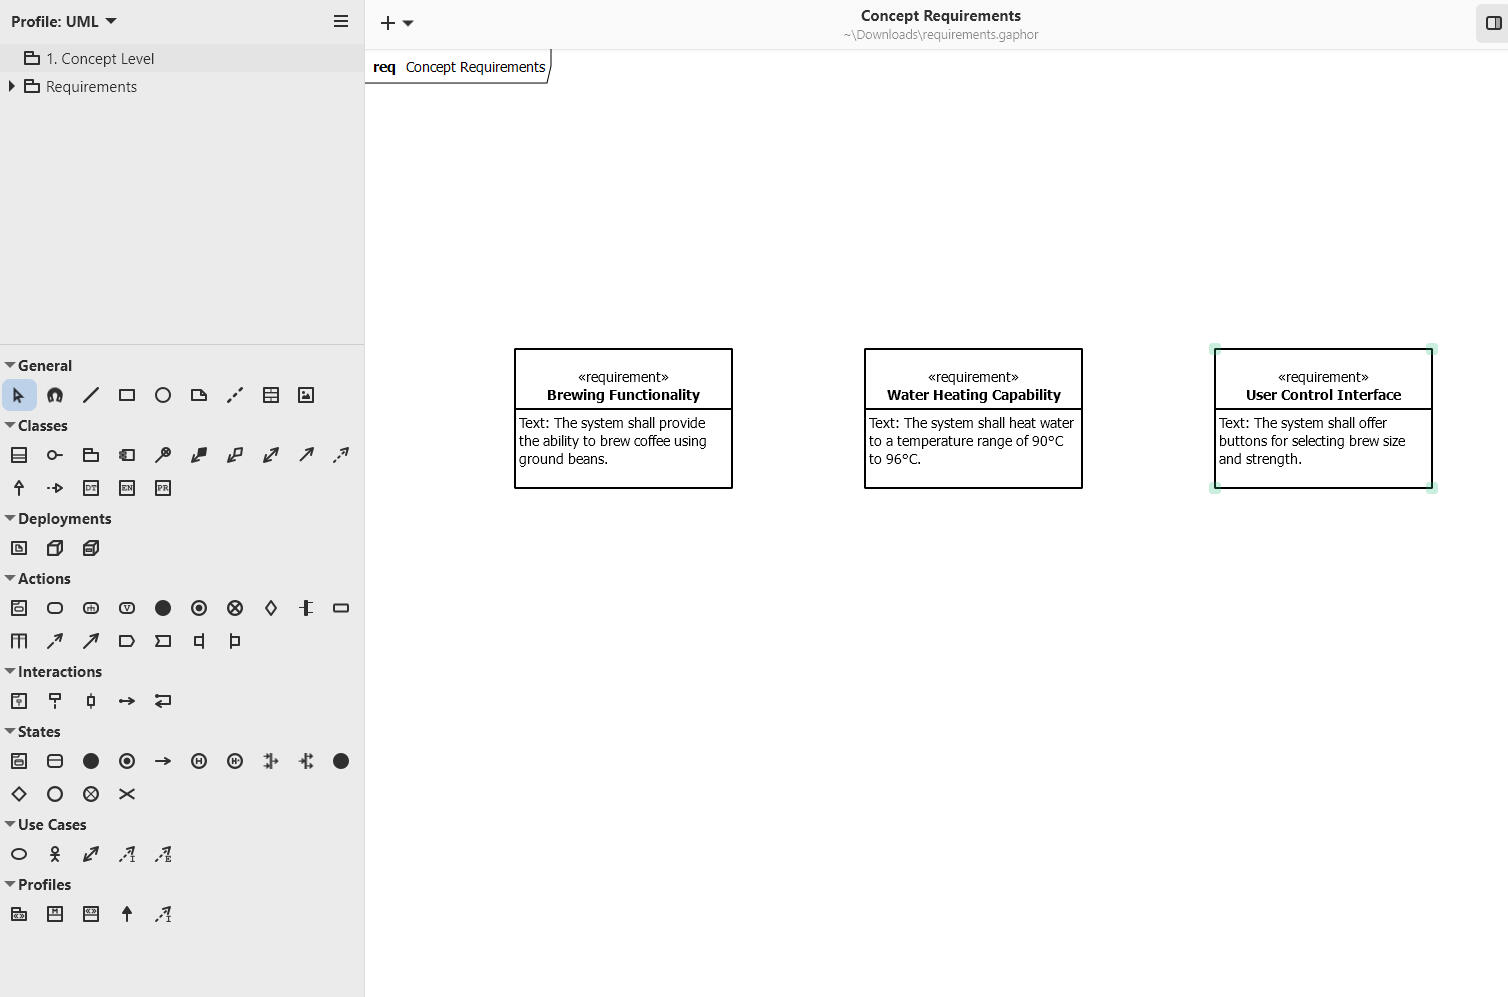
Download Gaphor (Windows & Mac)Example AI prompt: Create concept level requirements for building a coffee machine, keep a maximum of 5 important requirements.A sample output from Gaphor software can be seen below.
Feature Importance in Time Series Data

Brief SummaryThis academic project resulted in an interactive web application for comparing feature importance techniques in CNC machine energy consumption time series. Built with Python and Streamlit, the app presents precomputed results from our experiments, allowing users to visually explore and compare key drivers of energy usage across different machines, materials, and datasets. The app is publicly accessible at featureimportance app.Problem Statement / Research Questions1. How can we transparently identify and compare the most critical factors affecting energy consumption in industrial CNC machines using real-world process data?2. Which feature importance methodologies provide the most robust and insightful explanations for time series reflecting diverse machines, materials, and production settings?3. Can we create an intuitive web tool for engineers to interactively investigate and interpret results from multiple explainability techniques?Steps and Methodology1. Dataset Preparation and PreprocessingData Origin: The dataset comprised records from two machines (CMX, DMC), two materials (Aluminum and Steel), and two components (CP1, CP2), initially spanning 92 columns.Preprocessing:
- Removed 28 columns with missing (NaN) values.
- Further eliminated 6 columns for low relevance or redundancy.
- Retained 52 significant features and 4 energy-related target columns for analysis.Experimental Work:
- Performed all data cleaning, feature engineering, and experimental runs offline as part of the research phase.
- Results from the experiments (plots, tables, and rankings) were then integrated into the static web application for interactive viewing.2. Feature Importance Techniques ImplementedPermutation Importance: Assesses drops in model accuracy when feature values are shuffled, highlighting influential predictors for ensemble models.Integrated Gradients: Uses gradient-based attribution to quantify feature relevance in neural models (LSTM, FNN).WINit: Tailored for time series, WINit captures time-dependent effects and delayed influences on energy consumption.LIME: Generates interpretable, local surrogate models to explain predictions in a model-agnostic manner.3. Application ArchitectureStatic Results Browser:
- Users explore pre-loaded results generated from comprehensive experiments on the full dataset.
- All comparison plots, tables, and metrics displayed are based on these controlled experimental runs—no data upload or user-supplied data is required.
- Results are organized for comparison across machine types, materials (Alu/Steel), and different feature importance methodologies.User Experience:
- Select different techniques and scenarios from within the app’s interface.
- Instantly compare explanations and ranked feature importances across experiments and datasets.Key Takeaways1. Feature importance varies significantly by machine, material, and chosen explanation technique—underscoring the need for multifaceted analysis in industrial applications.2. Providing a user-friendly interface to fixed experimental results makes insights accessible to engineers and stakeholders without requiring technical setup or code.3. Specialized time-series explainability methods (like WINit and Integrated Gradients) reveal nuanced, temporal patterns in energy use that classical methods may overlook.Steps to Use the App1. Access the Application: Visit https://featureimportance.streamlit.app/.2. Browse Experiments: Select feature importance methods and scenarios using the app’s controls—no data upload required.3. View Results: Instantly explore visual comparisons, feature rankings, and metrics reflecting the experiments conducted on various machine types, materials, and components.4. Interpret Insights: Use tables and plots to understand which factors most affect energy consumption under different operational conditions.The underlying dataset and all displayed results are the outcome of offline experiments, ensuring a consistent and robust comparison environment for users.While our current application demonstrates feature importance analysis using precomputed results on the provided dataset, this framework can be readily adapted for real-world industry use. For broader or commercial deployment, a CI/CD pipeline could be established so that users are able to upload their own datasets directly into the app. The system would then automatically handle data preprocessing, model evaluation, and feature importance analysis, delivering interactive, up-to-date visual results through the Streamlit interface. This extension would transform the app from a static results browser into a dynamic, scalable platform for ongoing industrial analytics and insight generation.
Google Cloud-Enabled Analytics and Forecasting for MPD

Brief SummaryThis project involved analyzing and forecasting sales and profits for mobility products manufactured by a global company, using a rich dataset extracted from internal SAP Datasphere systems. The full data science and analytics lifecycle—from clustering markets and selecting product categories to machine learning forecasting and interactive dashboarding—was implemented using Google Cloud Platform (BigQuery, BigQuery ML, Kubeflow, Vertex AI, and Looker Studio), supporting strategic decisions in manufacturing and product distribution. The presentation is publicly accessible at GCP Market Prediction & Analysis.Problem Statement1. How can a global mobility company strategically plan production and sales by deeply understanding historical trends and projecting future sales, material demand, and profits?2. How can customer markets be optimally segmented for targeted planning using machine learning?3. Which product categories are most profitable and sustainable for future business growth?4. How should the company visually communicate insights to decision makers to enable actionable, data-driven management in a changing market?Methodology and Steps1. Data Acquisition and PreparationData Extraction:
- Sourced historical data on customers, orders, materials, products, and profits from the company’s SAP Datasphere using Cloud Data Fusion for seamless, visual data pipeline development.
- Integrated external currency exchange data to harmonize values between local (EUR) and USD pricing.Data Transformation & Cleaning:
- Uploaded and transformed CSV data into Google Cloud storage and BigQuery.
- Mapped schemas, standardized city and product names, handled missing or inconsistent data types, and adjusted column delimiters for accurate ingestion.2. Market Segmentation and Clustering- Customer markets were segmented using K-means clustering (BigQuery ML), grouping them by geographical location (country).
- This technique revealed strategic insights into regional customer preferences, local regulations, and supply chain logistics.
- Clusters and customer distributions were visualized on interactive maps and charts (Looker Studio) for clear communication of market segmentation.3. Product Category Selection- Analyzed all product categories to determine revenue and profit between 2011 and 2023.
- Touring Bike and Offroad Bike were identified as the most lucrative product categories, balancing both high revenue and healthy profit margins, ensuring business sustainability.4. Past Performance Analysis- Merged and aggregated key data tables (orders, products, materials, customers) in BigQuery.
- Created consolidated tables with monthly, country-wise summaries of sales quantity, revenue, material cost, and profit, enabling granular historical evaluation for the selected products.5. Sales, Material, and Profit Forecasting Using Machine Learning- Developed and deployed time-series models (using Exponential Smoothing) in Python notebooks—integrated directly with BigQuery data using BigQuery ML.
- Modeled and predicted 24 months (2025–2026) of sales quantities, revenues, expenses, and profits for each country and product.
- Generated future material requirements forecasts based on predicted sales and bill-of-materials analysis.
- Orchestrated and automated these processes with Kubeflow pipelines and Vertex AI, ensuring reproducibility and scalability.6. Visualization and Reporting- All results—market clusters, historical trends, forecasts, and key profit drivers—were visualized in Looker Studio dashboards.
- Dashboards enabled side-by-side comparisons of past and future sales, required materials, and profitability across different markets and products.
- Reported actionable recommendations for production planning, procurement, and marketing strategy based on visualized insights.Key Takeaways1. Combining cloud-based data integration, powerful ML/AI modeling, and interactive dashboards enables end-to-end analytics for manufacturing at scale.2. Market clustering by region improved targeting for sales and production planning.3. Focused analysis on high-margin product categories guides resource allocation for maximum business impact.4. Forecasts revealed declining sales in major products, but improved profit margins pointed to successful cost and pricing strategies; however, future trends indicated a need to reevaluate growth, procurement, and supply chain policies.5. The pipeline and platform architecture are robust and extensible for future strategic decision support in dynamic manufacturing environments.Steps to Extend the Analysis1. Data Integration:
Source and upload new business, operations, or external market data into SAP and Google Cloud storage.2. Market Segmentation:
Update clustering models with recent data for refined customer segmentation.3. Product Category Analysis:
Adjust the analytical framework to new product lines or changing business priorities.4. Run Forecast Models:
Use automated ML pipelines (Kubeflow/Vertex AI) for sales, profit, and materials forecasting, updating with the latest historical inputs.5. Visualize and Report:
Present insights via Looker Studio dashboards—share with stakeholders for transparent, data-driven planning.This project provides a scalable blueprint for advanced analytics in manufacturing—integrating robust data engineering, automated ML, and actionable visualization for modern, multi-market business needs.PresentationFor detailed slides covering the full analysis and implementation process, view the presentation here: Market Prediction & Analytics
Visualization of Process Engineering (Calciner) using unity 3d

Brief SummaryThis interdisciplinary project resulted in a comprehensive 3D simulation and visualization of an internal rotary calciner—a key industrial apparatus for materials processing—combining engineering design, process simulation, and interactive software development. I led 3D component modeling and Unity 3D application development, collaborating closely with Chemical Engineering students @ OvGU who provided process expertise to accurately simulate real-world industry conditions. The app is accessible both as a native Windows application and as a WebGL-based online demo: Web App LinkProblem Statement1. How can we make complex chemical engineering processes—like industrial calcination—visually intuitive and accessible for students and trainees?2. Can a virtual 3D replica, complete with interactive animations and process descriptions, help bridge the gap between theoretical knowledge and hands-on understanding of equipment operation?3. How can multidisciplinary teams efficiently collaborate to build educational apps that precisely mirror real-world device mechanics, control, and process flow?Methodology and Development StepsThe project team comprised students from Digital Engineering (software, 3D modeling, animation) and Chemical & Energy Engineering (process simulation, technical expertise) from OvGU.Work was steered in close collaboration with faculty advisors from both disciplines, ensuring authenticity in both engineering content and digital implementation.1. Sprint-Based Agile DevelopmentAgile Process: The full project was managed using an agile methodology structured into 10 sprints over 5 months, adhering to academic best practices for team productivity and clarity.Sprint Planning: Before each sprint, the team set specific targets (e.g., modeling the rotary drum, adding control panels, scripting animations, integrating UI navigation).Regular Reviews: Bi-weekly meetings included progress presentations, demos, code sharing, and feedback capture, aligning technical direction and educational value.Adaptive Workflow: Sprint retrospectives enabled the team to rapidly adapt designs, fix issues, and enhance features based on supervisor and peer feedback.Documentation: Each sprint closed with updated documentation and planning for the next phase.This process not only ensured project delivery to specification and deadline but also showcased your ability to operate effectively in a modern, iterative project management environment.2. Detailed Component ModelingData Collection: Measured and recorded physical parameters and operating details from the university’s pilot-plant rotary calciner.SolidWorks 2023: was used to design high-fidelity models of key apparatus parts: the rotary drum, motor, support rollers, heating coils, control panel, and exhaust system.Blender: served to refine and texture these models, providing realistic assets for simulation. Models were exported in .fbx format for Unity integration.3. Unity 3D Application Development- Imported all assets and constructed interactive scenes using Unity 3D.
- Developed C# scripts for simulating process behaviors: drum rotation, material flow, temperature change (with color feedback), and component animations.- Built a multi-scene workflow:
Intro and explanation scenes for theory and process context.
Component breakdown scenes describing each part with 3D interactivity.
3D exploration view enabling zoom, rotate, and component highlight.
Simulation mode for animating the calcination process with changing process variables.4. UX, Workflow, and Enhancements- Integrated informative dialogue, tooltips, navigation, and credits for clarity and engagement.
- Employed robust software patterns (Singleton, ECS, Decorator) for app structure and maintainability.
- Utilized iterative/agile development with regular feedback from both computer science and chemical engineering supervisors.5. Deployment- Built and tested a high-resolution Windows desktop application (optimized for 1920x1080).
- Ported to WebGL to allow universal browser-based access and sharing.Key TakeawaysBridging Disciplines: Effective collaboration between software engineers and chemical process experts is essential for authentic, educational digital replicas in engineering.Enhanced Learning: 3D simulation with interactive exploration and animation provides a significant advantage in understanding the structure, operation, and theoretical underpinnings of industrial equipment.Multipurpose Platform: The app serves as both a learning aid and a demonstration tool for students, educators, and researchers.Steps to Use the App1. Access the WebGL version:
Web App Link.2. Navigate the Interface:
- Start from the home screen: view introduction, credits, or begin the simulation.3. Explore Explanatory Scenes:
- Read about the calciner process and its industrial context.
- Move through detailed, animated breakdowns of each component.4. Use the 3D View:
- Rotate, zoom, and closely inspect the digital twin of the rotary calciner, aided by user-friendly controls.5. Run Process Simulations:
- Initiate the simulation to visualize calcination, watch material and heat flow, and see temperature-responsive color changes.6. End or Repeat:
- End the simulation, replay scenes, or return home as needed for repeated exploration.Future Enhancements- Integration of real-time process parameter controls (e.g., temperature, feed rate), enabling experiment-like exploration.
- Inclusion of quizzes and interactive challenges for deeper engagement.
- Potential expansion to multi-scenario simulations and VR-based immersive learning.This project is a model example of how agile methods, software engineering rigor, and strong interdisciplinary collaboration can deliver impactful educational tools for process engineering and beyond.
Sales - Profit Visualization using power BI
Brief SummaryThis project showcases an interactive Power BI dashboard developed using a comprehensive multi-year sales and profit dataset for a U.S. superstore, originally sourced from Kaggle. The dashboard provides insightful visualizations to analyze regional profitability, customer segments, product categories, and sales trends over time. The project highlights advanced data visualization techniques and facilitates deep exploration of business performance metrics through a user-friendly interface.Problem Statement1. How can retail data be effectively visualized to reveal key insights into sales and profit patterns across various customer segments, product categories, and geographic regions?2. What are the profitability trends over time and how do they vary between different sub-categories and market regions?3. Which customer segments contribute most to overall profitability, and which product categories yield consistent revenue growth?4. How can users interactively explore complex multi-dimensional sales data to aid business decision-making and strategic planning?Dataset Overview- The dataset consists of approximately 9,994 records, spanning sales from 2016 to 2019.
- Measures are in U.S. Dollars (USD).
- Key columns include customer segment (Consumer, Corporate, Home Office), product categories and sub-categories (Furniture, Office Supplies, Technology), shipping method, order date, geographic data (50 U.S. states grouped into 4 regions), sales amount, quantity, and profit figures.
- This dataset, sourced from Kaggle, realistically simulates a U.S. superstore’s transactional records enabling meaningful exploratory data analysis and visualization.Methodology and Steps1. Data Preparation and Cleaning
- Loaded and understood dataset variables and structure.
- Ensured data quality through validation of date ranges, categorical fields, and consistency across sales, profit, and customer segmentation.2. Dashboard Development in Power BI
Designed multiple visual components including:
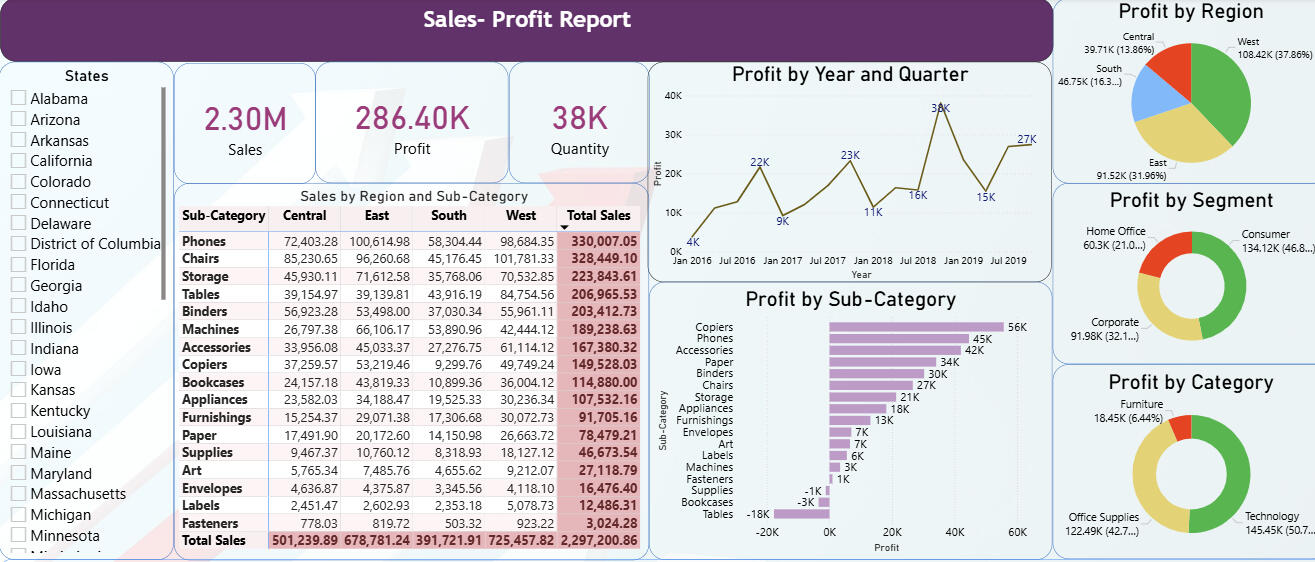
- Pie charts for profit distribution by region.
- Donut charts illustrating profit by customer segment and product category.
- Bar charts denoting profit by product sub-category.
- Line charts displaying trends in profit across years and quarters.
- Tabular views for detailed sales and profit statistics.
- Slicers for dynamic filtering (e.g., by state).
- KPI cards summarizing sales, profit, and quantity metrics.
- Emphasized interactivity with filters and drill-down capabilities to allow users to analyze data at multiple granularities.3. Interactivity and User Experience
- Enabled users to hover over visuals for details, slice data dynamically, and observe the impact of different filters on overall metrics.
- Created a clean, logical layout to foster intuitive navigation through different dimensions of the data.Key Takeaways
1. The dashboard offers a comprehensive business overview across time, product, and geography, empowering data-driven decision-making.
2. Visualization of sales and profits via multiple chart types highlights areas of growth and concern (e.g., most profitable regions or loss-making sub-categories).
3. Customer segmentation data illustrates how different client types contribute uniquely to revenue streams.
4. Use of interactive filters enhances exploratory analysis and supports bespoke reporting needs.How to Use this Project1. The Power BI report file (.pbix) is hosted on GitHub and can be downloaded by users from Sales Profit PowerBI.2. To interact with the dashboard fully, users should open the file using the Power BI Desktop application (free to download from Microsoft).3. Once opened, users can explore all visuals, interact with slicers, and dive deep into sales and profitability analysis as designed.4. For users without Power BI Desktop, the screenshots provided above demonstrates the key dashboard view to offer a snapshot of the interface and insights available.
PARSEC Racing - Student Formula Kart Project (2018–2019)
A short recap of our end-to-end journey: building a go-kart from scratch, preparing for national competitions, and learning through real race-week constraints.
Co-founded PARSEC Racing at Dayananda Sagar College of Engineering, Bengaluru, India and led a student team to design and build a go-kart from scratch, secure industry sponsorship, and compete in national karting championships.Build & Sponsorship (2018–2019)PARSEC Racing is a student automotive club founded in 2018 at DSCE. We formed a cross-functional team from our batch and worked end-to-end: concept, CAD/design, sponsor outreach, fabrication coordination, assembly, testing, and competition readiness. My role spanned Vice-Captain, Co-Designer, and team management—owning both technical decisions and execution planning (people, timeline, budget, vendor follow-ups).
IKC 2019 — Indian Karting Championship (Kolhapur)Indian Karting Championship (IKC) 2019 was our first-ever national competition, hosted at Mohite Racing Academy, Kolhapur (14–17 Feb 2019). We secured 15th position in the design event, cleared the technical inspection stages, and used the event as a reality-check for engineering reliability under competition conditions. We could not complete endurance due to a brake failure, which became a key learning for design validation, testing discipline, and safety-critical checks.
BFKCT 2019 — Bharat Formula Karting (Coimbatore)Bharat Formula Karting Season-2 (BFKCT) was held at Kari Motor Speedway, Coimbatore (28 Feb–2 Mar 2019). In this event we won 1st place in the Design Presentation category and received a cash prize of INR 15,000 (best virtual design), which was a major validation of our engineering approach and documentation quality. We also cleared the dynamic events successfully, showing the kart was not only designed well but also track-ready.
Go-Kart Launch — DSCE (4 Feb 2019)The PARSEC go-kart was formally launched on 4 Feb 2019 at DSCE, in the department. The launch was attended by Sri. Naveen Soni (Vice President, TKM Pvt. Ltd.), Sri. Sailesh Shetty (Vice President, TKM Pvt. Ltd.), and Sri. Galiswamy (Secretary, DSI). This milestone marked the transition from a student design-build initiative into a competition-ready vehicle showcased to institutional and industry leadership.
Downloads & LinksTeam Progress Report (PDF)
During my final year of bachelor’s studies, our team successfully built the vehicle and participated in the student competition. In parallel, we conducted structured recruitments from the junior batch and trained new members across key areas (design, manufacturing, operations, and documentation) to ensure long-term continuity of the team.Link to view the progress report submitted to university in 2020: Progress ReportOfficial College Website Article (Team Feature)
An official feature/article about our team published on the college website can be accessed here.
Link:https://www.dsce.edu.in/automobile-engineering/student-clubs-auto
Portable e-Cycle — Bachelor's Thesis Project (2019–2020)
The portable e-cycle is a comprehensive bachelor's final-year project completed at Dayananda Sagar College of Engineering (DSCE), Automobile Engineering Department (2019–2020).The project aimed to solve modern urban commute challenges—sedentary lifestyle, traffic congestion, pollution, and parking space scarcity—by designing a compact, lightweight, eco-friendly vehicle combining mechanical and electric powertrains with a scissor-fold portability mechanism.As project lead and CAD designer, I led the team through complete concept-to-prototype workflow: problem definition, literature research, design iterations using Autodesk Fusion 360, material selection analysis (aluminum 6061, GFRP, steel AISI 4130, carbon fiber), finite element analysis (FEA) in ANSYS Workbench 19.2, and hands-on fabrication using TIG welding.Design specifications achievedTop speed 25 km/h, range ~30 km per charge, total weight 16 kg (kerb), load capacity 90 kg, folded dimensions 0.75 × 0.42 × 1.15 m.The frame was analyzed for static structural loads, fatigue cycles, modal dynamics, deformation, and equivalent stress under multiple material candidates. Aluminum 6061 was selected as the frame material due to its optimal balance of factor of safety (3.205), weight (6.07 kg), cost, and manufacturability versus alternatives (FEA showed GFRP unsafe at FOS 0.68; steel too heavy at 17.67 kg; carbon fiber prohibitively expensive).Key technical highlightsScissor-fold mechanism (X-pattern rather than linear fold, enabling faster, easier portability); 250W BLDC hub motor with Li-ion battery (48V 4.8Ah or 36V 6.8Ah); component sourcing and cost optimization (total fabrication budget ~₹22,070 INR); design FMEA covering frame dynamics, chain wear, motor overload, battery safety, and braking system integrity; FEA fatigue life validation (1,108 cycles, satisfactory); modal analysis (8 natural frequencies ranging 106.86–559.53 Hz).The e-cycle promotes a healthy commute lifestyle, reduces carbon footprint vs. motorized transport, addresses parking constraints in dense urban areas, and combines pedal-assist flexibility with electric convenience.For detailed project presentation, please use below links:
Project Presentation: Portable e-Cycle Presentation
Project Report: Portable e-Cycle Report